Cu/SiO2 CATALYSTS OBTAINED BY CATIONIC ADSORPTION FROM DIFFERENT PRECURSOR SALTS
D.B. TAGUA, E. ALVAREZ ZURBANO, P.M. GÓMEZ LARGO and B.P. BARBERO
Instituto de Investigaciones en Tecnología Química (INTEQUI), UNSL-CONICET.
Facultad de Química, Bioquímica y Farmacia, Universidad Nacional de San Luis.
Almirante Brown 1455, C.P. D5700HGC, San Luis, Argentina.
bbarbero@unsl.edu.ar
Cite this article as:
Tagua, D.B., Alvarez Zurbano, E., Gómez Largo, P.M., Barbero, B.P. (2023) “Cu/sio2 catalysts obtained by cationic adsorption from different precursor salts”, Latin American Applied Research, 53(1) pp 31-36.
Abstract-- In this work the effect of different copper precursor salts (acetate, nitrate, sulfate) on the physicochemical characteristics of Cu/SiO2 catalysts is studied. The catalysts were prepared by the cationic adsorption method and analyzed by several characterization techniques (TGA, DSC, FTIR, XRD, AAS, SEM-EDS, N2-sorptometry and TPR). The results showed that the copper acetate precursor generated highly dispersed nano-sized copper oxide species on the silica surface, while the copper nitrate precursor leaded to bulk-type copper oxide strongly interacting with the silica, and the copper sulfate precursor did not decompose completely during the catalyst preparation. Besides, the acetate precursor produced the highest copper content, due to lower acidity of its solution, which generated a higher density of negative charge on the silica surface and a higher affinity for cupric ions. In conclusion, the great influence of the nature of the precursor salt on the physicochemical characteristics of silica-supported copper catalysts is established.
Keywords-- Silica-supported copper, cationic adsorption method, physicochemical characteristics
I. INTRODUCTION
Copper-based catalysts are widely used in a variety of industrial processes and laboratory-scale studies. Copper can be forming a mixed solid, such as spinels, perovskites, etc., or it can be supported as an oxide on a support material that provides a large surface area and adequate physical structure for its application in catalytic reactors. Cu/SiO2 catalysts, in particular, have been studied for a wide variety of reactions, such as hydrogenolysis reactions (Aubrecht et al., 2022; Zhu et al., 2015), oxalate and aldehyde hydrogenations (Huang et al., 2022; Zhang et al., 2012; Santori et al., 2000), alcohols dehydrogenation (Wang et al., 2003; Guerreiro et al., 2000), CO oxidation (Xi et al., 2014; Hossain et al., 2018), wet phenol oxidation (Zhong et al., 2012), among others.
The catalytic properties of supported copper catalysts are strongly influenced by the synthesis variables. Several researchers had studied the nature of the support used (Aubrecht et al., 2022; Hossain et al., 2018), the method of preparation (Aubrecht et al., 2022; Wang et al., 2003; Guerreiro et al., 2000), the copper loading in the catalyst (Zhang et al., 2012), and other parameters (Toupance et al., 2000; Toupance et al., 2002), demonstrating the effect on the physicochemical characteristics and catalytic behavior.
This work aims to evaluate the influence of different copper precursor salts (acetate, nitrate, sulfate) on the physicochemical characteristics of silica-supported copper catalysts (Cu/SiO2) when the cationic adsorption method is used for the preparation of the catalysts. The cationic adsorption method is based on the electrostatic interaction of Cu2+ cations with the surface charges of the silica support. The difference between the point of zero charge (PZC) of the silica and the pH of the solution containing the copper ions plays a fundamental role in this interaction (Munnik et al, 2015). Furthermore, the solution pH is defined by the nature of the anions of the precursor salts, and in this fact lies the importance of this study.
II. METHODS
A. Synthesis of catalysts
The silica support was obtained from a colloidal suspension of commercial SiO2 NexSil 20 Nyacol®, drying it at 70 °C for 24 hours. Then, the solid was ground and sieved using a mesh ASTM No. 140 (105 micron), and calcined at 300 °C for 2 hours. The catalysts were synthesized by the cationic adsorption method. For this, 0.2 M aqueous solutions of three copper precursor salts were prepared: copper sulfate (CuSO4·5H2O, Biopack), copper nitrate (Cu(NO3)2·3H2O, Merck) and copper acetate (C4H6CuO4·H2O, Fluka). In 50 mL of each solution, 5 grams of SiO2 were added and stirred in ultrasonic bath at room temperature for 30 minutes. Subsequently, the solid was vacuum filtered, dried in microwaves to constant weight and calcined in air at 500 °C for 2 hours. Microwave drying is a rapid method and has been shown to provide a very homogeneous distribution of the active phase in structured catalysts (Martinez et al., 2020). The catalysts obtained were called Cu/SiO2-α, where α represents the precursor salts: acetate (a), nitrate (n) and sulfate (s).
B. Characterization techniques
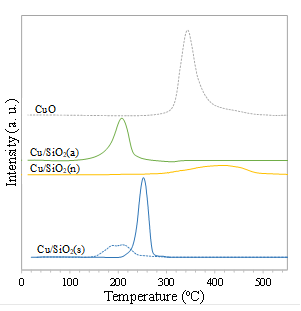
Thermogravimetric analyzes (TGA) were performed in a Shimadzu TGA 51 and differential scanning calorimetry (DSC) in a Shimadzu DSC 60, using about 5 mg of sample, a heating speed of 10 °C/min and a 50 mL/min airflow. Fourier Transform Infrared spectra (FTIR) were acquired with a Nicolet Protégé 460 FTIR instrument between 4000 and 250 cm-1 using KBr pellets. X-ray diffractograms (XRD) were obtained with a Rigaku ULTIMA IV diffractometer using a copper radiation source (λ=0.15418 nm) with a nickel filter, operated at 30 kV and 20 mA in the 2θ range from 10º to 70º. The copper content in the catalysts was determined by atomic absorption spectroscopy (AAS) using a Shimadzu model AA-6300 equipment at a wavelength of 324.8 nm, after acid digestion of the catalysts with HF. The catalysts were examined by scanning electron microscopy (SEM) using a LEO 1450 VP microscope coupled to a Genesis 2000 energy dispersive spectrometer (EDS). The nitrogen adsorption-desorption isotherms were acquired in a Micromeritics Gemini V equipment after to degas the samples at 250 ºC; and then, the specific surface areas by BET method (SBET), the pore volume (Vpore) and pore mean size (Dpore) by BJH method were calculated. The temperature programmed reduction (TPR) experiments were performed in lab-made equipment equipped with temperature and mass flow controllers and a thermal conductivity detector for recording the hydrogen consumption. Typically, 100 mg of catalyst, a heating rate of 10 °C/min from room temperature to 550 °C, and a 5% H2/N2 mixture at a flow rate of 30 mL/min were used.
III. RESULTS AND DISCUSSION
Firstly, thermal analyzes (TGA and DSC) of the dry solids were carried out in order to determinate the stability of the copper precursor salts used for the impregnation of the silica (Fig. 1). In all the TGA curves, a mass loss below 150 °C is observed, and it is associated with an endothermic event in the DSC curve, whereby can be attributed to dehydration of the samples. In the case of the catalyst prepared from copper acetate (Fig. 1A), a second mass loss is observed between 275 ºC and 310 ºC, which corresponds to an exothermic process in the DSC curve, so it can be assigned to the decomposition of copper acetate and release of carbon dioxide. The small mass losses detected at temperatures above 600 °C could be due to the combustion of carbonaceous remains produced during the decomposition of copper acetate. In Fig. 1B, corresponding to the catalyst prepared with copper nitrate, the second mass loss is observed between 230 ºC and 278 ºC, which could be originated by the decomposition of the nitrate generating the release of the corresponding oxides. Unlike what was observed with copper acetate, in the case of copper nitrate no evolution of heat is detected during its decomposition, probably due to the small heat of reaction that is expected for the decomposition of nitrate in air. For the catalyst prepared with copper sulfate (Fig. 1C), heat evolution up to 600 °C is not detected either. Regarding the TGA curve, a slight loss of mass is observed between 525 °C and 575 °C, and a more significant one at 610 °C. These mass losses at relatively high temperatures indicate a high thermal stability of the copper sulfate precursor (Alexandrescu et al., 1995).
To complement the results of thermal analysis, FTIR spectroscopy
measurements were made at the solids before and after calcination. Figure 2
also includes the spectra of the support silica and the precursor salts as
references. Silica exhibits the typical bands of SiO2 (Zhu et al.,
2015; Zhang et al., 2012). Likewise, all the charac-
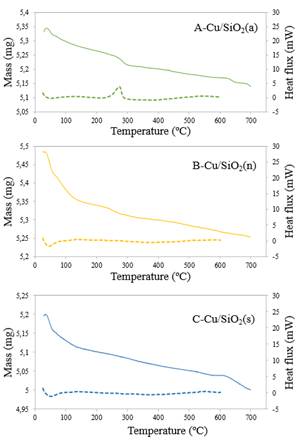
Figure 1: Results of TGA (solid line) and DSC (dotted line).
teristic bands of SiO2 are detected in the copper-bearing catalysts, although with a slight decrease in intensity, probably due to the copper-silica interaction. In the spectra of the uncalcined samples, absorption bands of the copper precursor salts are expected, and this is clearly observed in the spectrum of the sample obtained with copper nitrate, where the characteristic band of the nitrate group at 1384 cm-1 is present (Castro and Jagodzinski, 1991). This band disappears after calcining at 500 °C, corroborating the decomposition detected in the TGA tests. In the spectra of the catalysts prepared with copper acetate and copper sulfate, the bands corresponding to the precursors are not detected. In the case of sulfate, the bands appear in the same region where silica exhibits strong Si-O-Si bond signals, so it is difficult to detect sulfate ion bands. In the case of acetate, the absence of signals could be due to a very low concentration of acetate ions on the silica surface. On the other hand, regarding the copper species present in the catalysts, the FTIR spectra do not provide information, since no new signals attributable to copper species are detected, probably due to overlapping with the SiO2 signals.
In order to identify copper species, determinations by XRD were made.
As can be seen in Fig. 3, they all show a broad signal centered at the value of
2θ=22°, which is characteristic of amorphous silica. Only in the diffractogram
of Cu/SiO2(n) two weak signals are detected at 2θ = 35.5° and 38.7°
that correspond to the most intense diffraction lines of CuO monoclinic. In the
diffractograms
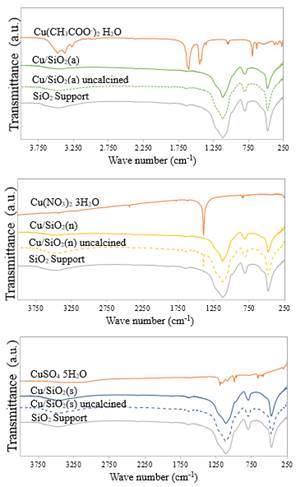
Figure 2: FTIR spectra of the precursor reagents, the silica support and the catalysts before and after calcination.
of Cu/SiO2(a) and Cu/SiO2(s), no other lines corresponding to phases containing copper are evident. This could be due to low concentration of copper species, to the formation of particles smaller than 4 nm, or to the formation of an amorphous phase.
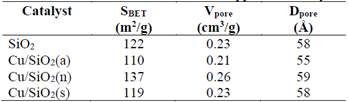
Atomic absorption spectroscopy (AAS) analyses were performed to determine the copper content present in the catalysts. As can be seen in Table 1, the catalysts prepared with nitrate and sulfate contain less than 1% w/w copper, while the catalyst prepared with copper acetate contains almost twice as much. Relating these results with those of XRD, it can be deduced that the absence of diffraction peaks in Cu/SiO2(s) could be due to the low copper content. In contrast, the lack of XRD signals in Cu/SiO2(a) would be due to the formation of an amorphous or nanometric copper oxide phase, probably highly dispersed on the silica surface. For Cu/SiO2(n), the copper content is below 1% w/w, but despite this, CuO signals are detected, so it can be inferred that this oxide would have an average crystal size enough large to be detected.
The remarkable difference in copper concentration in the sample
prepared with acetate with respect to those prepared with nitrate and sulfate
is explained by the different pH of the solutions of those precursor salts. The
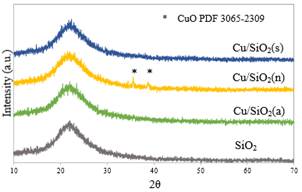
Figure 3: XRD of the catalysts.
Table 1: Cu content determined by AAS and H2/Cu ratio from TPR.
|
Catalyst |
Cu (%w/w) |
H2/Cu |
|
|
Cu/SiO2(a) |
1.38 |
0.97 |
|
|
Cu/SiO2(n) |
0.72 |
1.05 |
|
|
Cu/SiO2(s) |
0.79 |
2.86 |
|
0.2 M nitrate and sulfate solutions presented a pH of 3.86 and 4.10, respectively; while the 0.2 M copper acetate solution had a pH of 5.33. Bearing in mind that the cation adsorption method used to prepare the catalysts relies on the electrostatic interaction of Cu2+ cations with the surface charges of the support silica, it is important to consider the difference between the point of zero charge (PZC) of silica and the pH of the solution containing the copper ions (Munnik et al, 2015). In the case of silica, it has been reported that the value of PZC is around 2 (Mustafa et al., 2002). Therefore, the higher the pH of the solution of copper salts, the greater the difference with the PZC of silica. Furthermore, taking into account that the silica surface is negatively charged at pH above PZC, greater density of charged surface hydroxyl groups is expected when the solution pH increases. In conclusion, the higher the pH of the solution of copper salts, the greater the electrostatic adsorption of Cu2+ ions. So, the relationship between the pH of the solutions and the amount of copper present in the catalysts corresponds exactly to the preceding analysis.
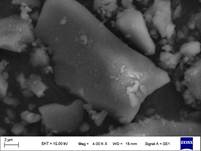
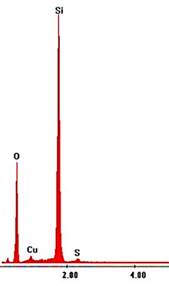
The observations by means of SEM indicate that there are no significant morphological changes in the silica support after the addition of the active phase. In Fig. 4, SEM images of typical catalyst particles alongside EDS spectrum are shown. Copper is detected in all catalysts, but the quantification is not reliable since the copper amount is close to the detection limit. A relevant result of microanalysis by EDS is the presence of sulfur (1.13 % w/w) in the Cu/SiO2(s) catalyst.
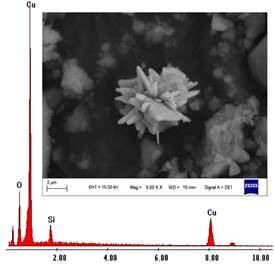
Another interesting observation is the formation of a “star” shaped
phase, in some of the SEM images of the Cu/SiO2(n) catalyst (Fig. 5).
Analyzing the composition by EDS, an elevated copper content was determined, so
it can be assumed that the phase is formed by the copper oxide taking as growth
nucleus a silica particle. The large particle size shown by this phase would explain
the appearance of the CuO diffraction lines even when the copper content is
lower than 1% w/w. The textural charac-